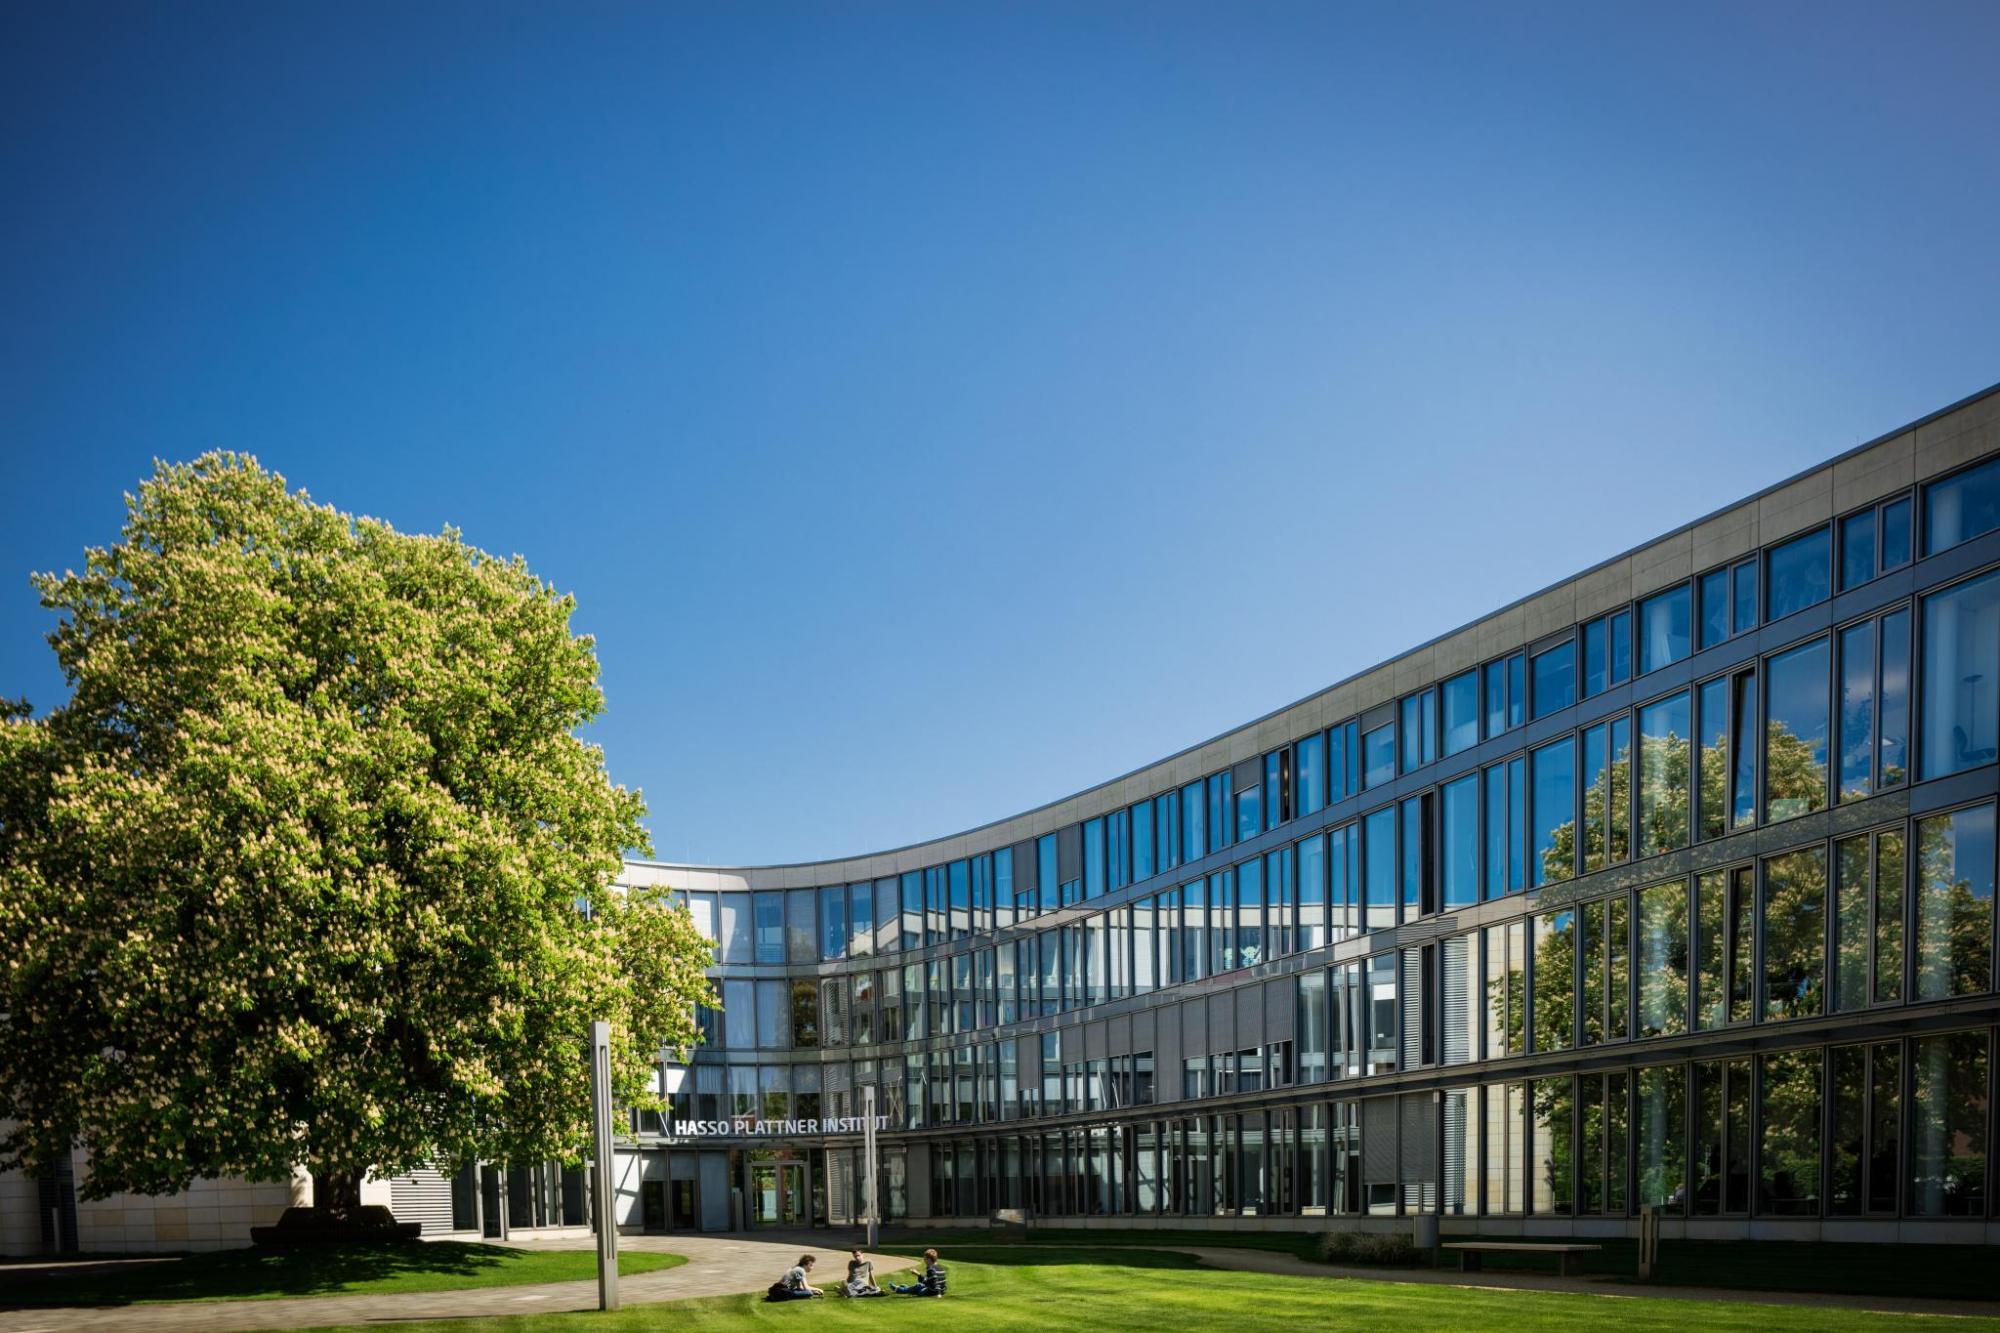
Hasso-Plattner-Institut
Prof. Dr. Tilmann Rabl
 

Sustainable Data Management

Summary written by Kaya Dilem

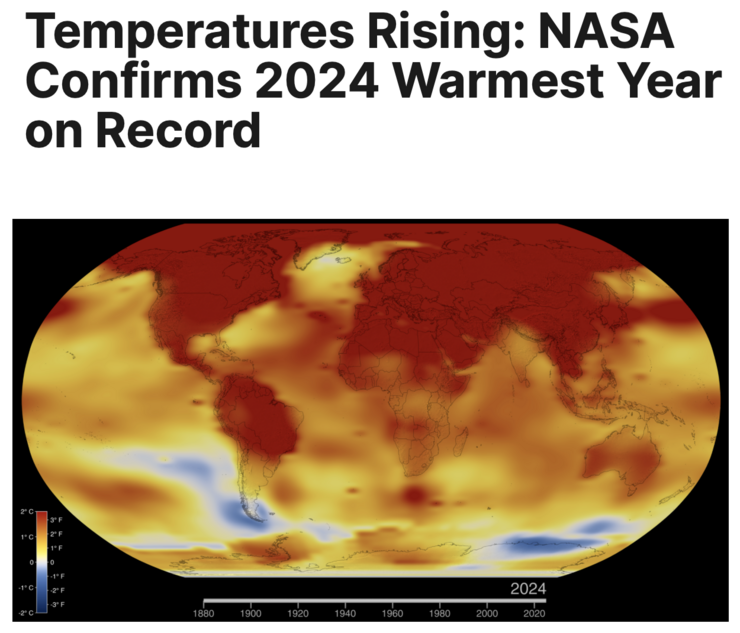
The year 2024 was the warmest ever recorded, and the maps below make that impossible to ignore - almost uniformly red.[1] Professor Tilmann Rabl, who holds the chair for Data Engineering Systems at the Hasso Plattner Institute, makes a disarmingly simple argument: the computing industry is getting bigger, not better, and the ecological bill is coming due. The talk walks through hardware trends, data center realities, and a decade of Intel server CPUs to show why "more efficient hardware" is not saving us - and why software efficiency and consumption limits matter more than ever.

    Global temperature anomalies. Source: [1]

    Sustainability ≠ Efficiency ≠ Performance

    The concept of sustainability goes back to Hans Carl von Carlowitz (1645–1714), who wrote about forestry: do not harvest more timber than the forest can regenerate.[2] The standard framing uses three pillars: environment, society, economy. The lecture is clear that the environmental pillar is load-bearing. Without it, the other two collapse.

    In computer science, performance, efficiency, and sustainability tend to get conflated. Rabl insists on keeping them apart:

    • Efficiency: resources needed per task.
    • Performance: how fast or how much work per unit time.

    The car analogy makes the point concrete. Transport 200kg of cargo over a certain distance. A truck does it in one trip at 80km/h. A supercar can only carry 100kg, so it needs three trips (out, back, out). Even at 240km/h it merely ties the truck; it would need 417km/h to beat it on time - and it burns far more fuel regardless.[3] In systems research, we routinely scale the workload to the hardware and call the result "efficient." In real life, the task is fixed, and the mismatch matters.

    The Hardware Wall

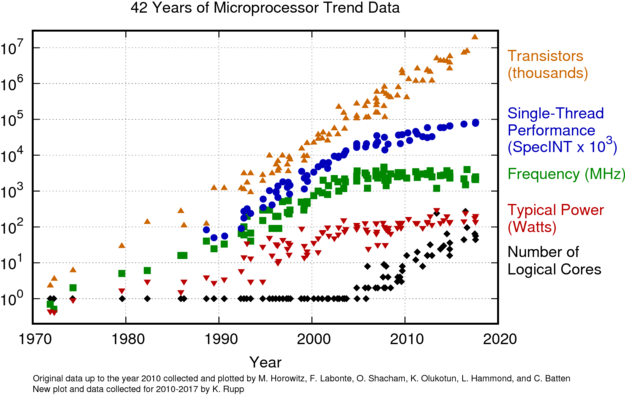
    For decades, Moore's Law[4] and Dennard scaling[5] delivered exponential performance gains essentially for free: more transistors, constant power density, rising clock speeds. That ended in the mid-2000s. Frequency plateaued. The industry pivoted to parallelism, but horizontal scaling means more consumed power, and only a fraction of the chip can be fully active at once.[6]

      50 years of microprocessor trend data. Source: [7]

      Today, there are two ways to push performance, and both cost energy:

      • Bigger chips. The Apple M1 is ∼120mm2; the M1 Ultra is ∼860mm2 (7.2×). More silicon, more manufacturing energy, more operational power.
      • Higher TDP. The M1 Max draws 92W at 0.21W/mm2. An NVIDIA H100 SMX draws 700W at 0.86W/mm2 - higher thermal density per area than a hot plate (0.06W/mm2).[3]

      Meanwhile, Wirth's Law holds: software is getting slower more rapidly than hardware becomes faster.[8] For decades this went largely unnoticed - each new hardware generation quietly absorbed whatever inefficiencies had accumulated in the software layer. Now that hardware gains have stalled, those inefficiencies are simply running on more energy.

      Data Centers: PUE Is Not the Number You Think It Is

      Data centers have improved their Power Usage Effectiveness (PUE). Google reports a fleet-wide PUE of 1.1, meaning 10% overhead for cooling and operations.[9] Sounds great. But as Rabl points out, PUE is like measuring a car's AC overhead: if my AC uses only 5% of fuel, that tells you nothing about whether the car gets 5L/100km or 20L/100km. PUE says the facility is efficient at delivering power to servers. It says nothing about whether those servers do useful work efficiently.[3]

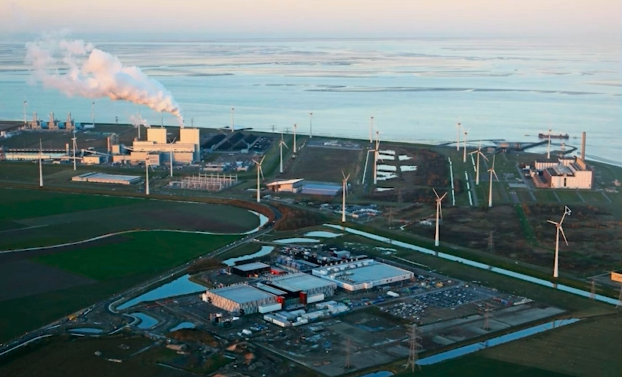
        Data Center behind the scenes. Source: [3]

        Zoom out further and the picture gets worse. The Google data center at Eemshaven shows windmills in its PR photos, but a different camera angle reveals coal and gas plants next door. The Jülich Supercomputing Centre (home to Jupiter, one of Europe's strongest supercomputers) sits beside the Hambach open-pit coal mine. xAI's data center uses rows of mobile gas turbines, which are less efficient than even a coal plant.[3]

        The numbers: in 2023, U.S. data centers consumed about 4.4% of national electricity, projected to reach 6.7–12% by 2028.[10] Ireland already sends 20% of its electricity to data centers. Cloud computing's carbon footprint now exceeds that of the airline industry.[10] All major cloud providers are missing their own carbon targets, and the primary driver is new hardware deployment.[11]

        A Decade of Intel Server CPUs

        Given this, Rabl's group asked the obvious question: if we have to buy servers, what does a decade of hardware improvement actually look like for database workloads?[3]

        They benchmarked top-tier Intel Xeon CPUs from 2014 (E7-4880 v2, 130W, 541mm2) to 2023 (Platinum 8480+, 350W, 4 × 472mm2). The trends:[3]

        • Core counts up. Frequency flat. TDP up. TDP per core down.
        • On SPECint: single-thread and multi-thread performance improve; energy efficiency rises.
        • On database workloads (TPC-H, parallel sort): gains are far smaller.

        The headline number: energy efficiency improvement for parallel sorting over the entire 10-year span is a factor of 1.45.[3] Meanwhile, TDP increased 2.7×. A generation ago, new hardware meant exponential jumps. Now the gains barely justify the embodied carbon cost of manufacturing a replacement.

          Energy efficiency for sort: 1.45× over 10 years. Source: [3]

          Embodied vs. Operational Carbon

          A server's total carbon footprint has two components:

          • Operational carbon: power consumption × grid carbon intensity (GCI). Germany's GCI is ∼344gCO2/kWh; Sweden's is ∼25gCO2/kWh. A Xeon Platinum 8480+ at 370W on the German grid emits ∼125gCO2/h.[3]
          • Embodied carbon: manufacturing, transport, end-of-life. Simplified: (Material + Energy × GCIproduction + GHGs)/Yield.[12]

          The HPIDES group built TCO2 (https://hpides.github.io/TCO2), an interactive tool for computing the total CO2 cost of server replacements.[13] Key insight: RAM dominates embodied carbon (66%), while CPU dominates operational carbon (89%). The break-even time for replacing a 2021 Xeon with a 2023 Xeon on a Danish grid (344g/kWh, SPECint, 30% utilization) is 1.2 years. On a Swedish grid with a sorting workload (25g/kWh, 60% utilization), replacing a 2014 Xeon with a 2023 Xeon takes 16.8 years to break even.[3]

          TCO2 tool: Total CO2 Cost of Ownership. Source: [13]

          The implication is clear: the ecological and economical lifespan of servers is increasing. Cloud providers already target 6-year replacement cycles. The EU's Right to Repair legislation does not currently cover servers, which makes little sense.[3]

          Why Efficiency Alone Is Not Enough

          The lecture ends on a note: Even if we build more efficient systems, Wirth's Law eats the gains: free capacity does not get saved, it gets filled with larger models, more services, more inference. The AI and cloud business model is built on expansion, not efficiency; an investor-driven arms race where the response to every constraint is "use more energy," not "use less."[3]

          Rabl's conclusion: hardware efficiency is no longer improving fast enough to bail us out. Ecological efficiency demands longer server lifetimes, better software, and more critically, real limits on consumption. Regulations will be needed. And academia has a role: demonstrating that efficiency can work, even when the industry is running in the opposite direction.[3]

          The forest, as Carlowitz understood three centuries ago, does not care how fast you cut.

          References

          1. National Aeronautics and Space Administration. (2025). Temperatures Rising: NASA Confirms 2024 Warmest Year on Record.https://www.nasa.gov/news-release/temperatures-rising-nasa-confirms-2024-warmest-year-on-record/
          2. Environment & Society Portal. (2025). Hans Carl von Carlowitz and "Sustainability".https://www.environmentandsociety.org/tools/keywords/hans-carl-von-carlowitz-and-sustainability
          3. Rabl, T. (2025). Sustainable Data Management [Lecture]. Lecture Series on Database Research, Hasso Plattner Institute.
          4. Mollick, E. (2006). Establishing Moore's Law. IEEE Annals of the History of Computing, 28(3), 62–75. https://doi.org/10.1109/MAHC.2006.45
          5. Dennard, R. H., Gaensslen, F. H., Yu, H., Rideout, V. L., Bassous, E., & LeBlanc, A. (1974). Design of ion-implanted MOSFET's with very small physical dimensions. IEEE Journal of Solid-State Circuits, 9(5), 256–268. https://en.wikipedia.org/wiki/Dennard_scaling
          6. Gropp, W. (2016). CS598 Lecture 15.https://wgropp.cs.illinois.edu/courses/cs598-s16/lectures/lecture15.pdf
          7. Rupp, K. (2018). 42 Years of Microprocessor Trend Data [Figure]. https://www.karlrupp.net/2018/02/42-years-of-microprocessor-trend-data/
          8. Wirth, N. (1995). A plea for lean software. Computer, 28(2), 64–68. https://deviq.com/laws/wirths-law
          9. Google. (2025). Operating Sustainably.https://datacenters.google/operating-sustainably/
          10. MIT Press Reader. (2025). The Staggering Ecological Impacts of Computation and the Cloud.https://thereader.mitpress.mit.edu/the-staggering-ecological-impacts-of-computation-and-the-cloud/
          11. Berger, C. (2025). Hidden Under All the AI, Big Tech Companies Are Missing Their Climate Targets.https://cathleenberger.medium.com/hidden-under-all-the-ai-big-tech-companies-are-missing-their-climate-targets-eb10cd2098af
          12. Ropo, M., Mustonen, H., Knuutila, M., Luoranen, M., & Kosonen, A. (2023). Considering Embodied CO2 Emissions and Carbon Compensation Cost in Life Cycle Cost Optimization of Carbon-Neutral Building Energy Systems. Environmental Impact Assessment Review, 101, 107100. https://doi.org/10.1016/j.eiar.2023.107100
          13. HPIDES. (2025). TCO2: Total CO2 Cost of Ownership.https://hpides.github.io/TCO2/