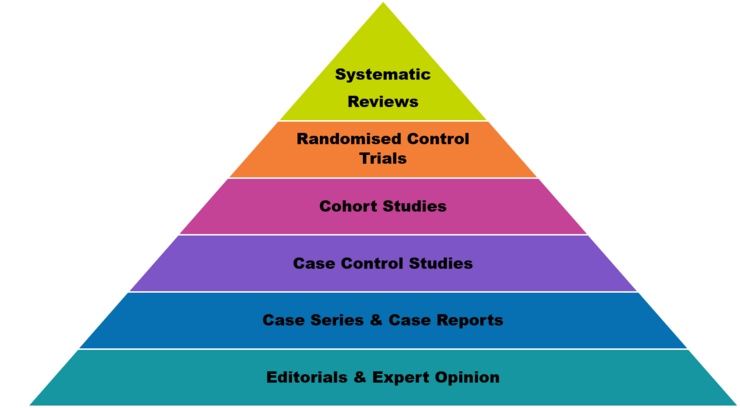
Fig. 1: A pyramid showing different levels of scientific evidence. Trustworthiness increases from the bottom up. Image taken from John Moritz Library.
Empirical Evidence
Research can be broadly categorized into two types: exploratory research and hypothesis-driven (or confirmatory) research.
Exploratory research focuses on uncovering potential hypotheses and generating ideas without a defined goal or the intent to produce evidence. It serves as a foundation for identifying topics worth investigating further.
Hypothesis-driven research, on the other hand, aims to generate evidence by testing specific hypotheses, often through falsification. For instance, while without adequate tools it may be challenging to prove that a chemical reaction produced element A, it might be possible to disprove that it is B by measuring its density.
In hypothesis-driven research, it is crucial to define hypotheses before conducting experiments to avoid drawing incorrect conclusions from the data. Conversely, analyzing existing data to infer potential effects is characteristic of exploratory research. Such hypotheses derived from exploratory research can then be tested through experiments explicitly designed for that purpose.
Experimental Design
Careful considerations must be made when designing experiments to ensure their efficacy, ethicality, and legality. For example, testing the effectiveness of a new drug by withholding life-saving treatment from one group of patients to create a control group would be highly unethical, as it puts lives at unnecessary risk. Instead, researchers use alternative methods, such as placebo-controlled trials, but only in cases where no proven treatment currently exists, ensuring participants are not deprived of standard care.
Definition of Objectives
The first step in designing an experiment is to clearly, rigidly, and with a high degree of specificity define the objectives of the experiment. The objective "show that our algorithm is faster than the state of the art" is defined very broadly, and it may be impossible to test if the algorithm is faster on all datasets in existence. A better defined objective may be "show that our algorithm A has a lower median run time when compared to the state of the art (algorithms B - K) on five commonly used datasets 1 - 5 using the 32-core processor X".
It is important to be careful to avoid drawing generalized conclusions from a very specific experiment's result.
Sources of Variation
It is crucial to understand both deliberate and undeliberate sources of variation influencing the experiment's result to achieve a robust experimental design.
- Treatment Factors: In an experiment, treatment factors are the variables that the researcher purposefully manipulates or controls to examine how they affect the result.
- Experimental Units: Experimental Units are the entities to which the treatments are applied. Variations can arise due to differences in these units. For instance, if algorithms are run on different computers, factors like CPU performance or hardware configurations can introduce variability.
- Blocking Factors: These are variables that can be controlled to reduce their impact on the result. For instance, lowering variability associated with hardware variations can be achieved by guaranteeing that all computers have the same quantity and speed of RAM.
- Covariates: Observable but uncontrollable factors, like power grid voltage deviations causing variations in CPU supply voltage and temperature.
- Noise Factors: Uncontrollable and unobservable sources, such as bit flips induced by a nearby unsealed radioactive sample, leading to longer memory access times due to error correction.
Assignment of Experimental Units to Treatments
The third step is to assign experimental units to the previously found treatment factors and levels. To avoid potential biases of the researcher or the experimental unit and the placebo effect (when experimenting on animals), this assignment should be randomized, usually using an urn-based model to prevent unbalance in the sizes of the assignments. Furthermore, experiments are often performed in a single-, double- or triple-blind setting. Single-blindness means that the experimental unit does not know which treatment is assigned to it. In double-blindness, the performer of the experiment does not know this either. Finally, in triple-blindness neither the experimental unit, nor the performer of the experiment, nor the one analyzing the resulting data know of the assignment.
Definition of Procedure
Taking all decisions made previously into account, step four is to specify the measurements to be made, the experimental procedure and the anticipated difficulties in clear and specific wording while avoiding the introduction of any biases. In the previously mentioned example, the measurements could be a time measurement from the beginning of execution of the chosen algorithm. The experimental procedure could be to ensure no other processes, except for the operating system, are run during this time. Anticipated difficulties could be colleagues trying to access the computers while the measurements are being performed.
Finishing the Design
When all of the above is done, a pilot experiment should be run. This will be reduced in scale and cost compared to the actual experiments, but can uncover errors in the experimental design, such as an unclear definition of the experimental procedure. These errors can then be corrected for the actual experiment.
The next steps are then to specify the model and outline the analysis. This could entail the metrics and statistical tests to employ in the analysis of the data produced by the later actual experiment.
Finally, the data gathered in the pilot experiment allows the estimation of the required sample size in the actual experiment for a certain significance level, statistical power, and effect size using power analysis. Statistical power is the probability of correctly rejecting a false null hypothesis, whereas the significance level denotes the probability of incorrectly rejecting a true null hypothesis. Common values used for statistical power are 0.8 to 0.9, while a commonly used significance level is 0.05.
The effect size is a measure of the relationship between variables or the difference between groups and can be calculated in many different ways, for example using Cohen's d. Cohen's d is useful for analyses using a t-test and is defined as the difference between the mean values of the two examined groups divided by the pooled standard deviation. The larger the effect size, the easier it is to detect. Having decided on these three parameters and the hypothesis test to use, the minimum required sample size that fulfills these requirements can then be calculated using software like G*Power, for example. If the required sample size is too large to be feasible with respect to the available funds or time, it is important to revise the experimental design from the beginning and narrow down its scope.
Summary
This blog emphasizes that designing experiments is a scientific process. By following a structured approach, researchers can:
- Minimize biases and confounding factors.
- Generate valid, reliable evidence
- Uphold ethical and legal standards.
These principles provide a solid foundation for students and researchers to conduct effective experiments and contribute meaningfully to scientific knowledge.
References