Figure 6 – Elements of a good graph.
Depending on the type of data and graph, additional – or fewer – elements may be required. For instance, a legend is necessary when presenting multiple datasets, and the total sample size (N) is particularly important for pie charts.
Also note that the graph and its caption should contain enough information for it to be readable on its own without the surrounding text, though of course the general context can be assumed to be known.
If applicable, consider including details such as the data source, explanatory notes, and thoughtful use of colors and shapes.
Good Graphic Checklist - #goodGraphicCheckList
Complementary to graphs, including visuals like images or tables in your work can also enhance clarity — if done thoughtfully. A structured approach ensures that these visuals are effective and aligned with your goals. The checklist below offers a straightforward requirements checklist to help you evaluate if the reader is provided all information necessary to evaluate and understand the figure and its goal.
Table 4: Checklist for basic graphic types
| Images | Tables |
|---|
| Title and number: Provide a clear title and number to identify the image. | Title and number: Assign a descriptive title and unique number for easy reference. |
| Caption: Include a caption that explains the image’s content. | Clear dataset: Ensure the dataset is well-organized, with all units labeled for rows, columns, and subcategories. |
| Source: Clearly state who created or provided the image. | Reference in the text: Cite the table in your text to integrate it into your narrative. |
| Reference in the text: Mention the image directly in the text to connect it to your content. | |
Steps to Create a Good Graphic - #5StepToGoodGraph
Despite all the discussed pitfalls, creating an effective graphic is simpler than it may seem. The worst pitfalls and most common mistakes can be avoided by always keeping in mind which message you want to communicate and basing all your following choices on said message. Specifically, you can use the following five overarching steps as a guide to ensure clarity and accuracy in your data visualisations, no matter if you want to use graphs, images or tables. These steps not only help avoid common mistakes but actively empower you to communicate effectively.
- 1. Be 100% clear on the overall communication goal.
- 2. Be 100% clear on what the Graph/Graphic is communicating.
- 3. Based on the message select the most appropriate Graphic type and given data.
- 4. Design the Graphic to clearly communicate the message.
- 5. Integrate the Graphic in your text/presentation.
Let's break them down:
It’s crucial to first establish clarity about the overall message we aim to communicate (Step #1). Once we have a clear understanding of the topic, we can move to the next step, where we define the specific goal of the graphic—what exactly it is intended to communicate (Step #2). These first two steps are the most crucial ones, but also the easiest ones to miss – so make sure you consider them when creating your next graphic!
The choice of the graphic type depends on both the nature of the data and the message we want to convey (Step #3). Based on the data, we then select the most suitable type of graph or graphic and proceed to create it, ensuring that it effectively communicates the intended message (Step #4).
The final step is integrating the graphic into the content (Step #5). This involves referencing the graphic within the content in a way that clearly explains its purpose and communicates the intended message seamlessly.
While explanatory context can make a graphic easier to understand, the ultimate goal is to create a meaningful and well-designed graphic that speaks for itself.
Conclusion
Graphs and graphics should not be created simply for the sake of it (see Table 3: #Don’ts). Their creation must be driven by a clear purpose, the data's context, and the need to effectively communicate the message visually.
Poorly designed graphics are common but avoidable by always keeping your communication goal in mind and adhering to the #5stepToGoodGraph checklist and Table 4: Checklist for Good Graphic Types. These guidelines help to improve data visualization skills and ensure a meaningful presentation of findings.
Understanding common pitfalls like misleading scales or spurious correlations can improve mindfulness about manipulation or misrepresentation when creating or interpreting graphics.
If you want to see more…
Information Is Beautiful is a renowned platform specializing in data visualization and information design. It provides visually appealing and insightful representations of complex data, serving as an excellent example of how effectively design can communicate information. So if you need inspiration for your next graphic, or if you just want to look at beautiful data, check it out!
Sources
Figure 0, Figure 2, Figure 7 and the images in Table 1 were drawn by the creators of this summary. All other images are taken from Prof. Bolsover's presentation that this summary is based on, though Figure 5.3.3 was modified by us and on Figure 1.2 to increase visibility we have adjusted the contrast and perspective of the image.
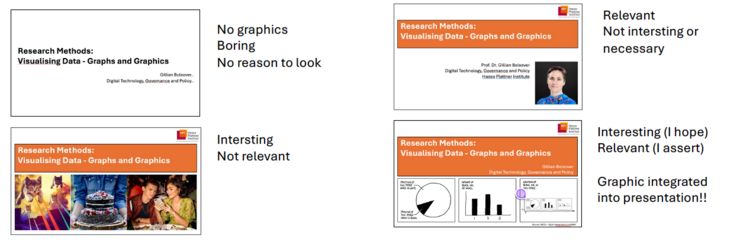
Figure 7 – Bad graphics distract or even detract from the point you want to make. Unless your point is laser-eyed cats.