Hasso-Plattner-Institut
Prof. Dr. Felix Naumann
 

Seminar Text Visualization

With the ever increasing volume of data in the modern world, data visualization has become an essential component of every data analysis task. Visualization is an effective way to convey complex information and acts as a bridge between data and decisions.

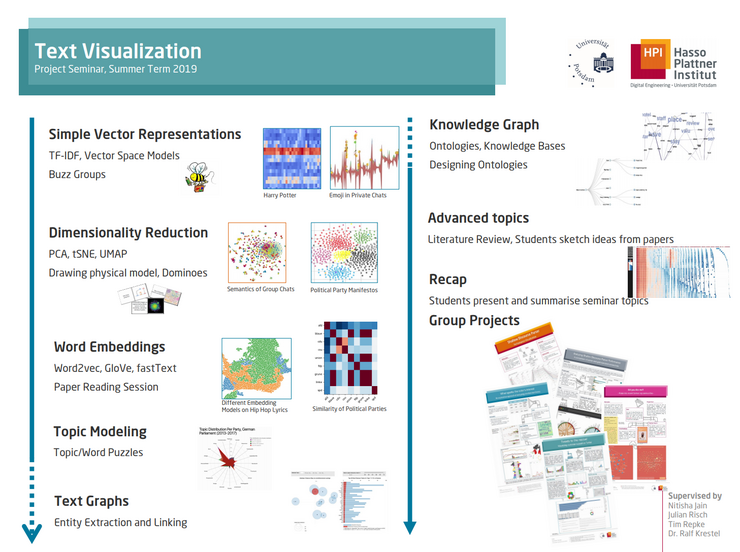
This seminar will discuss the techniques and tools for creating efficient visualizations for the most important tasks related to large textual datasets.
The seminar is geared to be a series of highly interactive sessions with the students, seeking active classroom participations. The sessions will comprise of topic introductions, brainstorming for ideas, short group activities and active discussions. To maximize the practical learning, students will be expected to submit short practical assignments for the individual topics every week.
The second part of the seminar will consist of a project to be chosen by the student teams.
 

We host all seminar details and materials on GitLab.
Please contact us for access.

Prerequisites

There are no prerequisites except for being open and motivated to learn about text analysis and tools to analyize and visualize large text collections.

Learning Objectives

Students will learn to...

  • perform common text analytics tasks to explore and understand a given text dataset.
  • represent large text corpora in visual form.
  • use various tools to process and visualize text data.
  • understand research papers and report on their own projects' progress.

Grading

Students are supposed to do homework assignments in the first phase and to write blog posts throughout the project phase to describe and share their progress.

The final grade will be based on selected homework assignments and the weekly blog posts.

Schedule

Time: Tuesday, 17:00 (!!moved from Monday!!)
Location: Campus II, F-E.06

DateTopic
09.04.Introduction and Organization
16.04.TFIDF/VSM + Visualization
23.04.Dimensionality Reduction+PCA+tSNE+ Visualization
30.04.Word Embeddings + Visualization
07.05.Topic Modeling + Visualization (ggf. am 9. oder 10.)
14.05.Text Graphs + Visualization
21.05.Knowledge Graph + Visualization
28.05.Advanced topics
04.06.Recap
11.06.Project Pitches
18.06.Projects in groups
25.06.Projects in groups
02.07.Projects in groups
09.07.Projects in groups
16.07.Final Project Presentation
01.08.Final Submission (Blog Post)

(subject to change)

Resources

Collection of data visualization tools here.