Joint Visualisation of Network and Text Data
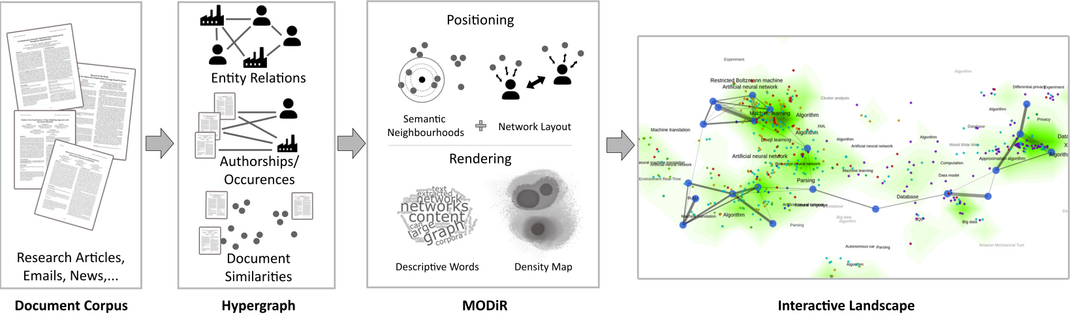
Many large text collections exhibit graph structures, either inherent to the content itself or encoded in the metadata of the individual documents. Example graphs extracted from document collections are co-author networks, citation networks, or named-entity-cooccurrence networks. Furthermore, social networks can be extracted from email corpora, tweets, or social media. When it comes to visualising these large corpora, either the textual content or the network graph are used.
With MODiR (multi-objective dimensionality reduction), we propose to incorporate both, text and graph, to not only visualise the semantic information encoded in the documents' content but also the relationships expressed by the inherent network structure. To this end, we introduced a novel algorithm based on multi-objective optimisation to jointly position embedded documents and graph nodes in a two-dimensional landscape.
- Demo (also includes more info and a project overview)
- Code on GitHub (Dimensionality Reduction)
- Code on GitHub (MODiR Viewer)