Hasso-Plattner-Institut
Prof. Dr. Felix Naumann
 

Mondrian: Detecting Layout Templates of Multiregion Files

We live in the information era: data has been defined "the new oil". Not only they both constitute a fundamental resource of nowadays' connected world, but akin to oil, data also need to be extracted and refined before serving any practical use.

Spreadsheet files are one of the different formats in which data is stored and distributed, commonly used in enterprise contexts as well as in open/governmental data portals.

Although spreadsheets contain cells in a grid-like structure, the data they contain is often arranged with a free layout, with no clearly defined tabular structure. Or worse, data cells are grouped in several, independent regions that have to ultimately be split by end-users which are interested in their content.

Consider the following file, belonging to the FUSE corpus (Barik et al. (2015), extracted from a governmental open data portal:

A CSV extracted from a governmental open data portal

Not only there are empty rows inbetween valid data rows, but there appear to be two distinct tables, identified by the header cells that read "Business QuickFacts" and "GeographyQuickFacts".

In general, spreadsheet files can contain multiple "regions" that may serve multiple purposes: tables, footnotes, or additional metadata. We define such files as multiregion. In files that originate from the same source, it is possible that region layouts are repeated equally but with different data content.

In light of automated data preparation, extraction, or integration, there is great value in recognizing the presence and layout of regions within a spreadsheet, and discovering that other files share an equal layout.

We designed an automated approach to detect multiple regions in a spreadsheet, describe their layout using a graph representation, and compare these layouts with a similarity flooding-based algorithm [1,2].

An overview of the Mondrian pipeline

The Mondrian Approach

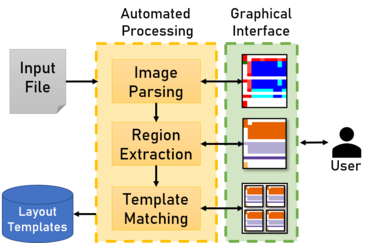
The intuition of Mondrian [1] is parsing spreadsheets as images to inspect their visual properties and search for multiple data regions.

The goal is to identify multiregion templates, i.e., file layouts that occur in multiple files.

First, the cells of a spreadsheet are converted into pixels, encoded with different colors, such that cells with similar syntax share similar colors (e.g., integer numbers are dark blue and floating point numbers are light blue, while strings are red).
Then, Mondrian detects multiple regions, partitioning the image into groups of adjacent pixels and clustering them together to form regions.
For each of the extracted regions, Mondrian calculates a "fingerprint" which describes its syntactic and structural properties and it can be used to compare regions across different files. Files that show at least one similar region are more probable to share the same layout, therefore are selected as candidates instances of the same template.

Each file layout is then described with a connected graphs that encodes the information about the regions that it contains and their connectivity (i.e., how they are arranged relative to each other in the spreadsheet). Finally, using a graph similarity score, we measure the similarity between file layouts that had similar regions.

Usability

Identifying layout templates in multiregion files requires a successful region extraction phase. To improve the usability of Mondrian, we designed a graphical interface to assist end-users [3]. Users are able to load a given spreadsheet file, run the automated region detection algorithm, and visualize its results as rectangular overlays on the spreadsheet cells.
With simple mouse interactions, the tool allows to adjust the size of the rectangles, drag and drop them along cells, as well as create or delete existing rectangles.

The graphical interface also includes a panel to visualize and edit the results of the template recognition stage. At a glance, users are able to view the files grouped by their templates, along with the details of each template, e.g., the number and name of the files it contains. By selecting a pair of files, either within the same template, or from two different templates, users are able to compare their content, visual layout and the similarity score assigned to them by Mondrian.


Visualizing large and complex layout templates is an interesting research challenge - one that we deem crucial to bridge the gap between hand-crafted and systematic data preparation in the spreadsheet domain.

Resources

  • Code Repositories:
    • Mondrian is an open source project. Its code is available on the project page at GitHub.
  • Datasets:
    • Each dataset link points to a folder that includes the CSV files and, if available, their annotations in form of JSON documents. The folders contain the annotations for the region boundaries as well as for layout templates. If the original dataset contained Excel files that were converted to CSV, the folders also contain the information about hidden and merged cells in the original files.
Dataset# Files# Regions# TemplatesDescription
DECO8543,785750The DECO dataset, an excerpt of the larger Enron spreadsheet corpus annotated for the region extraction/table recognition and template extraction tasks.
FUSTE8861,857136

The FUSTE dataset, an excerpt of the larger FUSE spreadsheet corpus, annotated for the region extraction/table recognition and template extraction tasks.

US Census99N/A16 (detected)

A dataset collected from the US census bureau open data portal, used for demonstration purposes and not manually annotated.

  • Online demo:
    • To explore the interactive interface of Mondrian, an online demo is available here.

Publications

2022


Contacts

This research project is conducted at the Data Preparation group. If you have any question, interesting idea, or request, please contact Gerardo Vitagliano.