Hasso-Plattner-Institut
Prof. Dr. Felix Naumann
 

Description

In this project seminar, we investigate and improve anomaly detection algorithms for multivariate time series. The participants will receive a broad selection of state-of-the-art anomaly detection algorithms (with code and papers) and are then challenged to beat these approaches in runtime and/or precision. Techniques that we consider for this task involve, inter alia, workload parallelization and distribution, streaming, ensambling, machine learning, and hybridization.

To get started, we provide the following resources to all participants:

  • Real-world datasets: ~500 datasets (multivariate time series with anomaly labels)
  • Dataset generator: a dataset generator to generate even more training and testing data
  • Algorithms: 66 time series anomaly detection algorithms (~25 multivariate approaches)
  • Scientific publications: a list of papers and documentation for the different algorithms
  • Evaluation setup: an evaluation framework (python) that automatically tests different algorithm-dataset-parameter combinations and calculates important quality and performance metrics

The schedule of this seminar should roughly be as follows :

  1. Introduction session about the state-of-the-art with subsequent literature and code research
  2. Brain-storming session about challenges and improvement opportunities with subsequent team building and topic selection
  3. Syncronization sessions (weekly) about development progress and ideas during a longer development phase.
  4. Intermediate presentation session about development ideas, preliminary findings, and challenges
  5. Final presentation session about development results and evaluations
  6. Scientific writing session with subsequent technical report writing phase to record seminar result

    Background

    Fig.1: Anomaly in a single channel of a multivariate time series
    Fig. 2: Anomaly that can only be observed in the combined inspection of both channels

    Detecting anomalous subsequences in time series data is an important task in many areas, ranging from manufacturing processes over finance applications to health care monitoring. An anomaly can indicate important events, such as production faults, delivery bottlenecks, systems defects, or heart flicker, and is, therefore, of central interest. Because time series are often large and exhibit complex patterns, data scientists have developed various specialized algorithms for the automatic detection of such anomalous patterns. Multivariate time series, which are time series with more than one channel (floating point value), are particularly challenging, as anomalous patterns can be found in any single channel and even combinations of channels. For this reason, anomaly detection in multivariate time series is very complex and comes, i.a., with the following challenges:

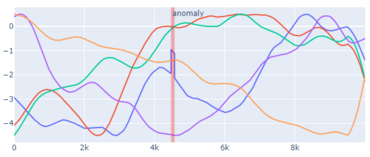
    • Localization: Anomalies can appear in only a single channel (see Fig. 1), in multiple channels, and in all channels at the same time.
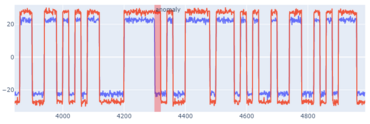
    • Correlation: Anomalies can appear as correlation anomalies, in which all individual channels behave normally but some subset of channels is out-of-sync (see Fig. 2).
    • Dimensionality: Due to the curse of dimensionality, anomalies become very hard to detect on multivarite datasets with many channels but only limited length.
    • Complexity: Mutlivariate time series are not only long (high number of data points), but also wide (high number of channels/dimensions), which in many cases leads to huge amounts of data that need to be processed within certain time and memory limits.

    Most existing solutions fail in at least one of these challenges. In the seminar, we will consider certain multivariate datasets from one of our industry partners, for which most anomaly detection algorithms struggle to find any, let alone the desired, anomalies. This shows that existing multivariate anomaly detection approaches must be improved further to overcome the mentioned challenges. Our goal is, therefore, to beat all these challenges at the same time and present one (or multiple) algorithms that are truely useful in practice.

    Goals

    In the seminar, the participants will form teams of two students. The goal for every team then is to develop an improved multivariate time series anomaly detection algorithm that can beat the state-of-the-art algorithms (for a specific use case or in a specific scenario) in possibly many aspects. Improved in this conetxt means at least one of the following:

    • More reliable: The developed algorithm is more robust against uncommon data formats and values, missing data points, etc. It can produce results, where other algorithms give up.
    • More accurate: The developed algorithm can produce qualitatively better results according to quality metrics, such as area under the ROC-curve (ROC-AUC) or average precision (AP).
    • More efficient: The developed algorithm can process larger datasets in shorter time and/or with lower memory requirements than the existing approaches while not (significantly) falling behind on result quality.
    • More capable: The developed algorithm can detect anomalies in certain datasets or of certain types that no existing algorithms can detect.

    Prerequisites

    For this seminar, participants need to be able to program fluently in at least one higher-level (functional or object-oriented) programming language, such as Java/Scala/Kotlin, Python, C++, Ruby etc. The seminar also requires some fundamental knowledge about basic algorithms and data structures.

    The following skills are a plus, but can also be learned during the seminar:

    • Experience in Python, Numpy, and PyTorch, because most of the existing algorithms are implemented in these technologies
    • Knowledge about the development of efficient and scalable algorithms (ideally Distributed Data Management)
    • Some fundamental understanding of data mining and machine learning algorithms

    Organization

    The organizational details for this seminar are as follows:

    • Project seminar for master students
    • 6 credit points, 4 SWS
    • At most 8 participants (4 teams á 2 students)
    • Weekly meetings and at least two larger presentations (intermediate and final)
    • Supervisors: Sebastian Schmidl, Phillip Wenig, Thorsten Papenbrock (remote), and Felix Naumann
    • Appointments: Wednesdays at 17:00 - 18:30 in F-E.06, Campus II, HPI (we might change that to a better slot after the seminar has started)
    • We plan to meet on-site (at HPI) for the introductory sessions and the weekly meetings while following all required regulations. Please plan your semester accordingly, because we assume your regular attendance. However, if it gets necesary due to regulation changes or other reasons, we will switch to an online mode.

      On the first appointment on 27.10.2021 at 17:00 in F-E.06, we will give an introduction to the seminar and its topics. This session will be open for all of you.

      Afterwards, we request you to register for this seminar firm until 29.10.2021 12:00 by sending an informal e-mail to sebastian.schmidl(at)hpi.de with the subject: "Registration to Large-Scale Time Series Analytics seminar". The email should include any prior knowledge of you that is relevant to this course (e.g. HPI courses in the data engineering, distributed computing, or machine learning area) and students that you would like to team up with in a project in case you want to join as a team (both of you need to send an e-mail). In case of more than eight registrations, we might need to choose the up to eight participants randomly. We will notify the selected participants on Friday, 29.10.2021, in the afternoon.

      The grading will be based on the following tasks:

      • Oral exam (mündliche Prüfung)
        • (10%) Active participation during all seminar events.
        • (30%) Presentations including:
          • (15%) Midterm presentation
          • (15%) Final presentation
      • Demonstration of a developed software program (Demonstration eines erarbeiteten Computerprogramms)
        • (20%) Implementation & Documentation
        • (20%) Evaluation
        • (20%) Technical report writing (~6 pages per team / ~3 pages per person according to a two-column ACM template, e.g. \documentclass[sigconf,screen,nonacm]{acmart})

      Time Table

      DateTopic
      27.10.2021 F-E.06Seminar introduction (Slides)
      29.10.2021 12:00Deadline registration and subsequent acceptance notification
      03.11.2021 F-E.06Kick-off & introduction to state-of-the-art (Slides)
      17.11.2021First bi-weekly meeting
      01.12.2021Bi-weekly meeting
      15.12.2021Last bi-weekly meeting before christmas holidays (online only)
      05.01.2022First bi-weekly meeting after christmas holidays
      12.01.2022Midterm presentations (part1)
      19.01.2022Midterm presentations (part2)
      31.01.2022Submission of algorithms for evaluation run 1
      02.02.2022Bi-weekly meeting
      16.02.2022Bi-weekly meeting
      28.02.2022Submission of algorithms for evaluation run 2
      02.03.2022Bi-weekly meeting
      16.03.2022Last bi-weekly meeting
      22.03.2022Final presentations
      27.03.2022Artifacts & report submission

      Literature

      The collection of existing approaches (code, documentation, and papers), as well as relevant related work will be shared with you, once you are accepted to the course. The material for our time series anomaly detection evaluation paper is published at https://hpi-information-systems.github.io/timeeval-evaluation-paper/.